

Section 4
4The Implementation Roadmap
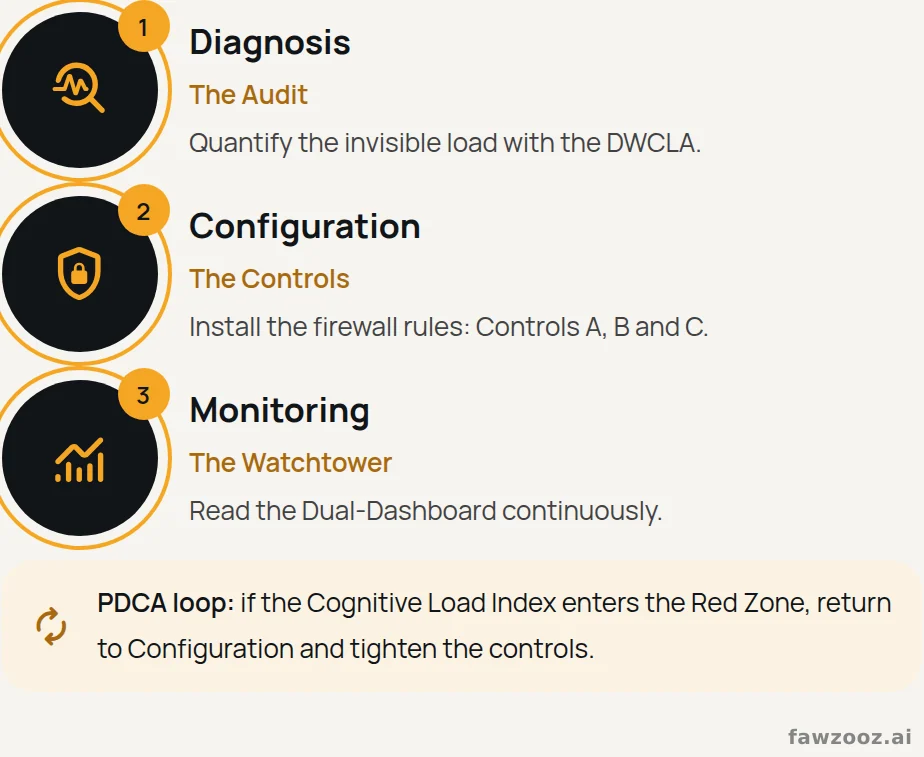
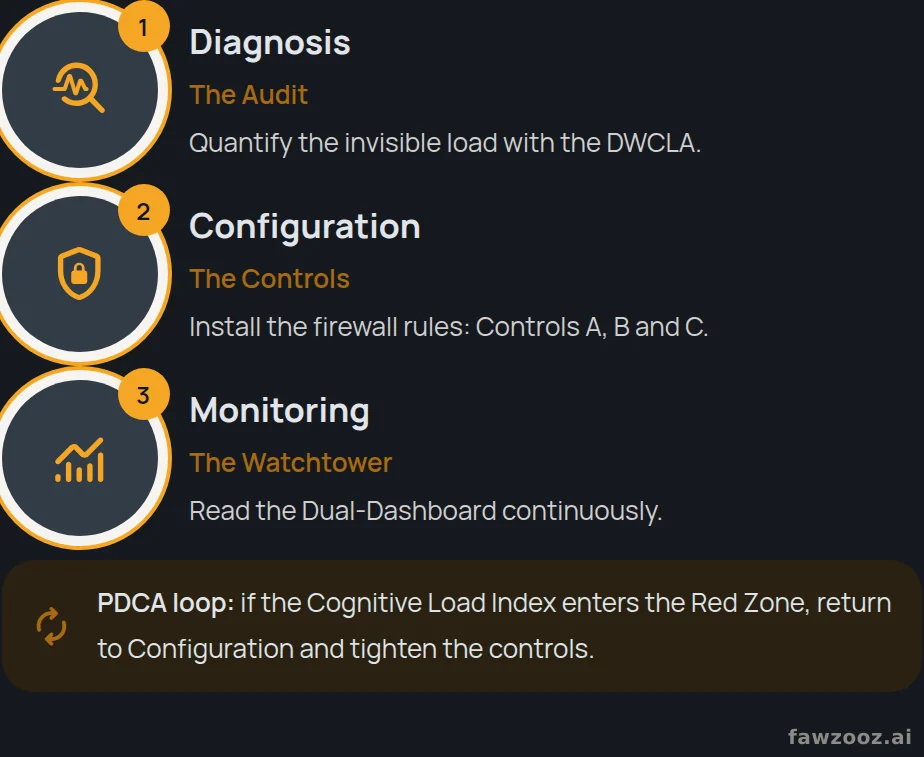
Adopting standards is meaningless without execution. The following roadmap outlines how organizations can deploy the framework, aligned with the PDCA (Plan-Do-Check-Act) cycle.
Text in this figure
1 · Diagnosis · The Audit · Quantify the invisible load with the DWCLA. · 2 · Configuration · The Controls · Install the firewall rules: Controls A, B and C. · 3 · Monitoring · The Watchtower · Read the Dual-Dashboard continuously. · if the Cognitive Load Index enters the Red Zone, return to Configuration and tighten the controls. · PDCA loop: · Figure 2. The three-phase implementation roadmap, run as a continuous improvement loop.
Phase 01 of 3 · The Audit
Diagnosis
Objective
Quantify the invisible load. Before deploying controls, map the threat landscape using the Cognitive Load Assessment (see Appendix A). Look for correlations between high AI usage and high anxiety scores.
- 77% of employees say AI tools increased their workload
- 71% of full-time employees report burnout
Source: Upwork Research Institute (2024).
- Benchmark: In a 2024 study by the Upwork Research Institute, 77% of employees using AI said the tools had added to their workload, and 71% of full-time employees reported burnout. Use these figures as an external reference point for your internal audit.
Phase 02 of 3 · The Controls
Configuration
Objective
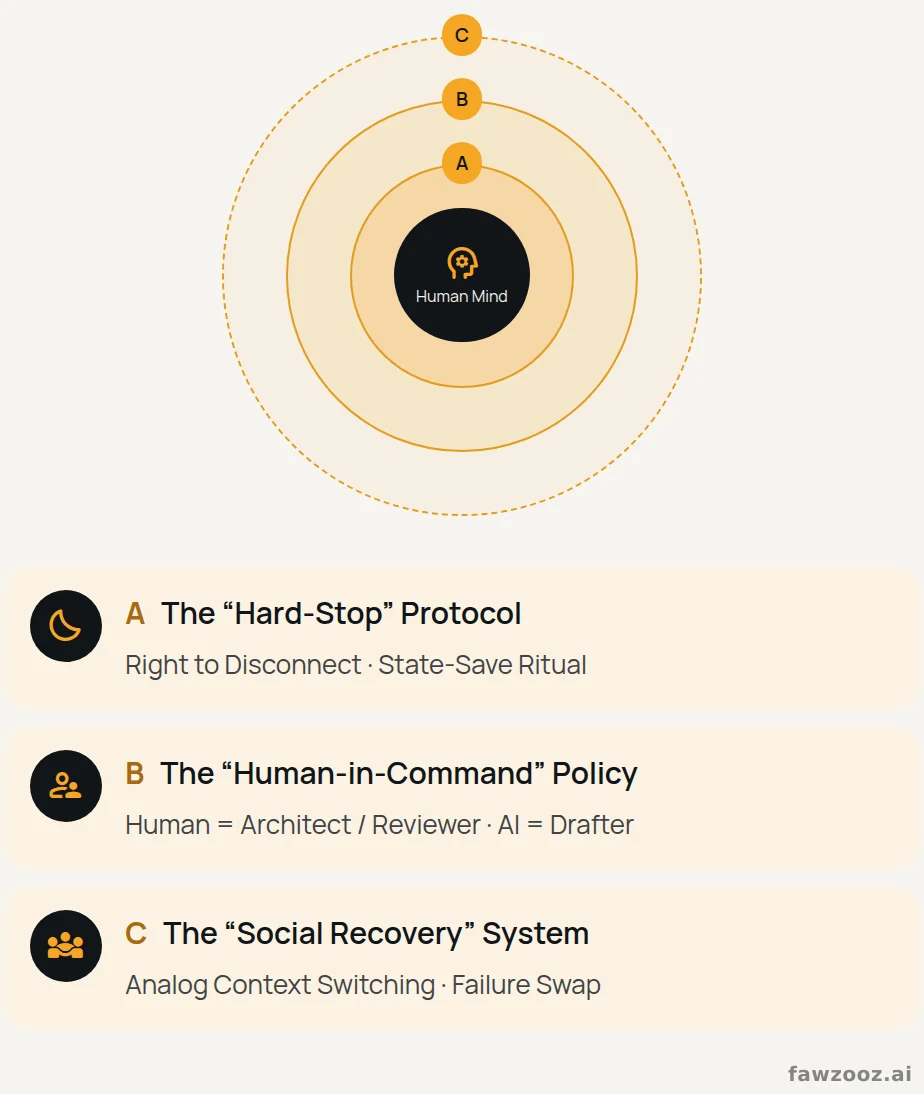
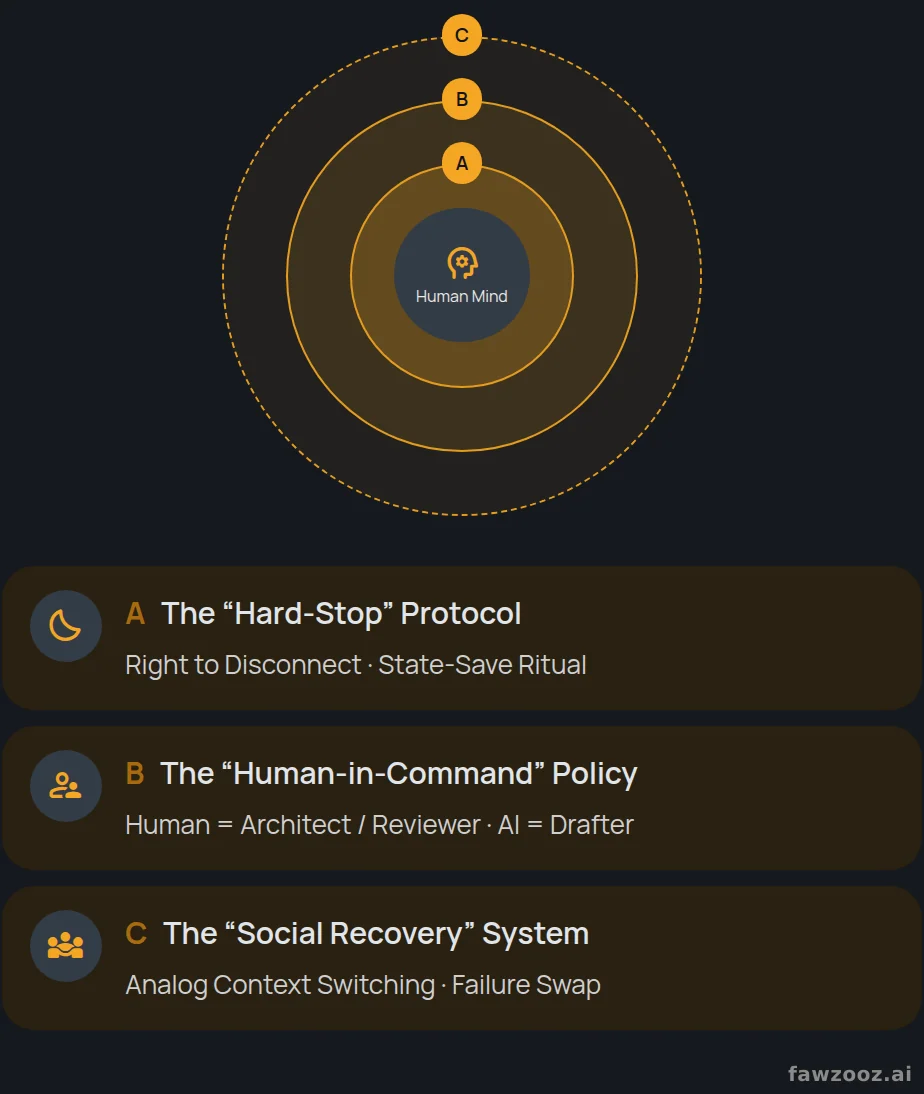
Install the firewall rules.
Text in this figure
Human Mind · C · B · A · A · The “Hard-Stop” Protocol · Right to Disconnect · State-Save Ritual · B · The “Human-in-Command” Policy · Human = Architect / Reviewer · AI = Drafter · C · The “Social Recovery” System · Analog Context Switching · Failure Swap · Figure 3. Three layered controls protect the Human Operating System.
Control A · The “Hard-Stop” Protocol (Flexible Application)
- Mechanism: Implement a technical “Right to Disconnect.” Non-emergency notifications are blocked after hours.
- The Ritual: Institute a mandatory “State-Save Ritual”: a 15-minute period before logout where workers document open tasks. If it’s written down, the brain can sleep.
Note
This control adapts to critical incidents; “Break-glass” procedures apply for genuine emergencies.
Control B · The “Human-in-Command” Policy
- Mechanism: Explicitly define the hierarchy of intelligence. Job descriptions must reflect that the human is the Architect/Reviewer and the AI is the Drafter. Junior staff should be mandated to attempt manual problem-solving before engaging AI to preserve self-efficacy.
Control C · The “Social Recovery” System
- Mechanism: Combat digital isolation through “Analog Context Switching”, mandatory screen-free breaks. Introduce “Failure Swap” sessions where leaders share AI hallucinations or mistakes to build psychological safety.
Phase 03 of 3 · The Watchtower
Monitoring
Objective
Continuous improvement via Data Visualization. Organizations must adopt a “Dual-Dashboard” approach to monitor system health.
View 1 · The Performance View (DORA Metrics)
- Deployment Frequency: Measures velocity; forced high frequency creates “Deployment Fatigue.”
- Change Failure Rate: Tracks failure %; a sustained rise can be an early signal of an overloaded team.
View 2 · The Human-OS View (IEEE 7010-2020 Metrics)
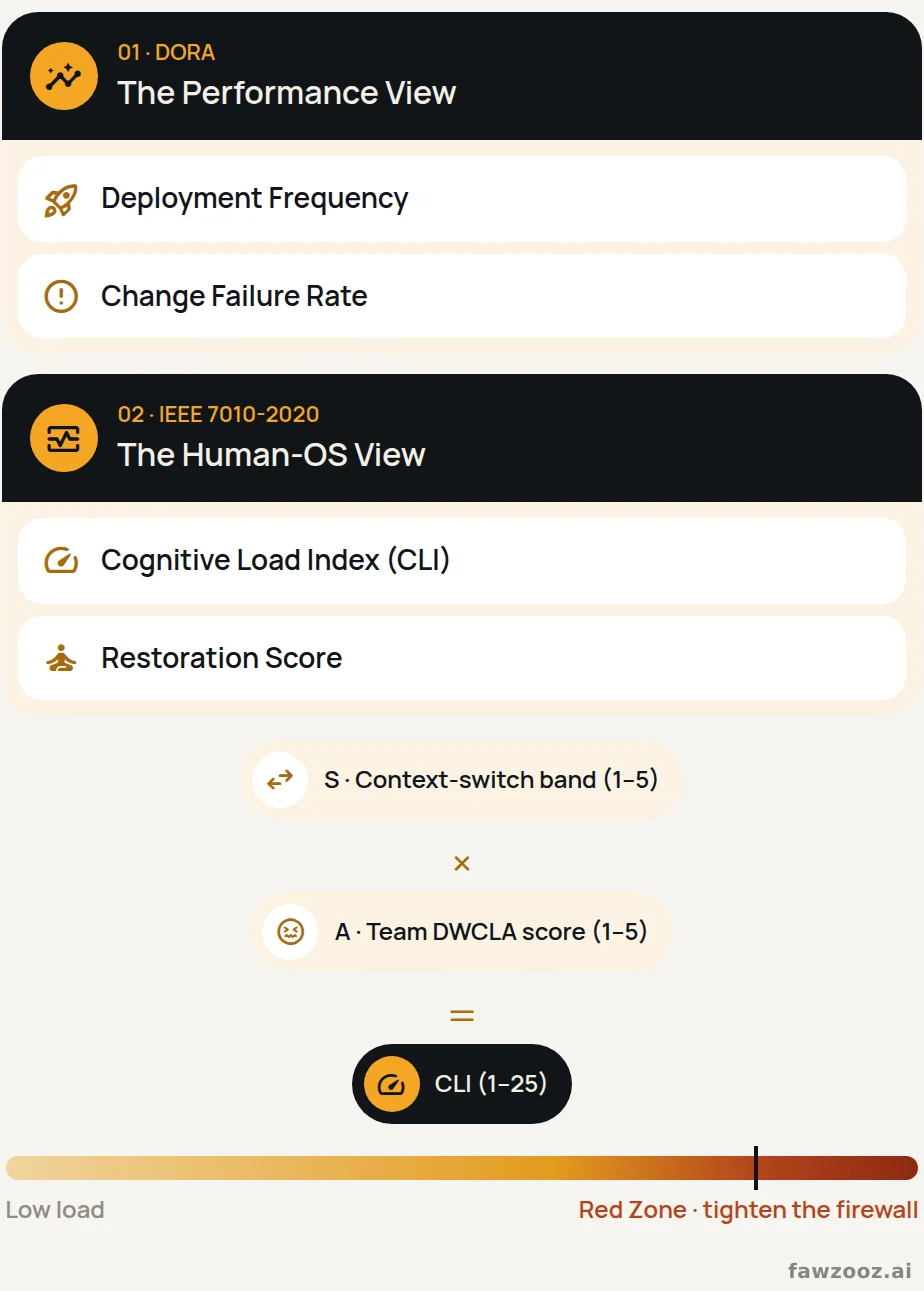
- Cognitive Load Index (CLI): Measured at team level as S × A, where S is the context-switch band (1: fewer than 4 per hour · 2: 4–7 · 3: 8–11 · 4: 12–15 · 5: 16 or more) and A is the team’s average score on the Cognitive Load Assessment (1–5). The CLI therefore runs from 1 to 25: Green 1.0–7.9 · Amber 8.0–15.9 · Red 16.0–25.0. These thresholds are starting points; calibrate them against your own data after the first quarter.
- Restoration Score: Percentage of team members taking full “uninterrupted” breaks.
Text in this figure
01 · DORA · The Performance View · Deployment Frequency · Change Failure Rate · 02 · IEEE 7010-2020 · The Human-OS View · Cognitive Load Index (CLI) · Restoration Score · S · Context-switch band (1–5) · × · A · Team DWCLA score (1–5) · = · CLI (1–25) · Low load · Red Zone · tighten the firewall · Figure 4. The Dual-Dashboard: performance and human health are read side by side.
Red Zone
If Performance rises while the team CLI enters the Red Zone (16.0 or above), or climbs for three consecutive readings, the system is overheating and the firewall must be tightened, for example by reducing sprint velocity.
Privacy by Design
Anxiety scores are health-related personal data. Participation is voluntary, responses are anonymous, and results are reported only as team aggregates for groups of five or more. No individual score is ever shown on a dashboard or used in performance evaluation.
Tip: use ← → to move between sections.